
Adobe Report Builder Unleashed:
Your Quick-Start Guide to Faster, Smarter Excel Reporting
Adobe has recently updated their long serving Excel plug-in Report Builder and for a certain subset of Web Analysts, this was very exciting indeed.
This blog will tell you why you should be excited about it and explain how to download and get started!
What is Report Builder?
Report Builder is a plugin for Microsoft Excel which allows you to connect to the Adobe Analytics APIs and pull data directly into your Excel worksheet.
You can add schedules and email recipients, enabling you to set up complex reports in Excel and have them automatically sent to your stakeholders weekly or monthly.
Why did it need updating?
There were a few reasons why an all new version was required:
- Old Report Builder used the v1.4 Analytics APIs, which meant you were limited to two dimension breakdowns on any request; traffic dimensions (props) were only able to be used with Visit and Page View metrics and conversion dimensions (evars) were only able to be used with Custom Conversion Events.
- Old Report Builder needed to be installed via an executable as an Admin user. So, in a lot of corporate environments you’d need to get approval and have IT install it for you. Not ideal and access was sometimes refused.
- Old Report Builder only worked on PC, so Mac users had to install a virtual machine, Windows and Office.
- It used what looked like an old Visual Basic style interface, which was slow and ugly.
New Report Builder uses the v2 APIs – the same APIs as Workspace uses – removing the limitations on traffic/conversion dimensions and opening up multi level breakdowns.
It installs in Excel, doesn’t need Admin permissions on your laptop and it works on Mac and Office 365 online! And it integrates nicely into Excel rather than using an old style pop up.
And it even supports both AA and CJA!
How do I install it?
Open Adobe Analytics, go to the Tools menu and select Report Builder. Click the “Download Now!” button.
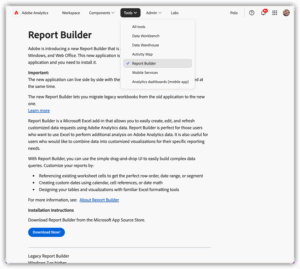
Unlike the old Report Builder you no longer need computer admin permissions to install it. Go through the installation steps to add the extension to Excel.
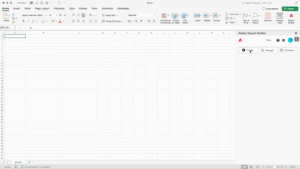
Now when you open Excel you’ll have the icon in your toolbar:
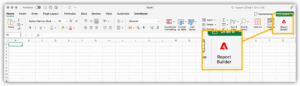
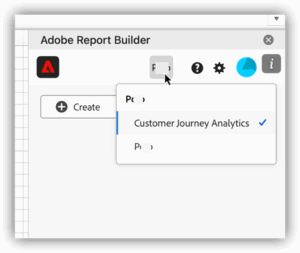
Clicking the icon opens Report Builder. You’ll need to sign-in and then you get the nicely integrated panel in the side of your Excel sheet.
Hidden Tip: Click your account company name to switch between AA and CJA. The icon subtly changes from red on black (for CJA) to red on white (for AA).
Create a new report
Click the Create button. Select the cell reference to place the result table, choose your Report Suite and date ranges and then click Next.
Whereas the old RB required you to select a “report” and then customise it (the same way you would do in the old Reports interface in AA), the new layout is more like an Excel pivot table builder. You drag dimensions and metrics into Column, Row and Values boxes to build the report exactly how you want it.
As you drag the components in, the main Excel sheet updates to show you how the final table might look.
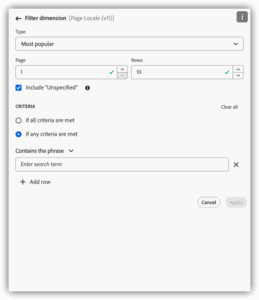
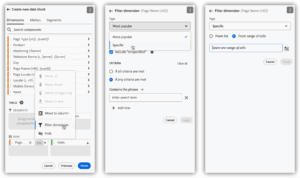
Click on the three dots to open the context menu where you can add value filters or set how many rows are returned:
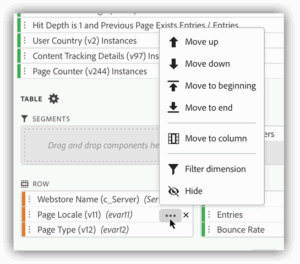
Click Finish to run the query and return the data.
To edit an existing query, click on one of the cells in the output table and then click Edit data block from the RB panel. This opens up the same editor so you can tweak and rerun the queries. You can also copy and paste requests, which is useful if you want several similar requests in the sheet, maybe with slightly different dates.
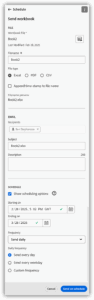
Scheduler
One of the key features is the ability to schedule a report to be sent out to a distribution list on a regular basis.
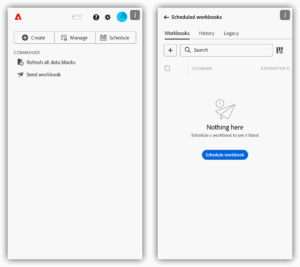
To set up a schedule click on the Schedule button from the first screen, then click either the blue button or the plus icon.
You can modify the filename to add the date and time. This is useful for daily or hourly reports – we use this in almost every scheduled report we send.
In the schedule options you can select daily, weekly, a few different month options and yearly, and there are some further options depending on which frequency you choose. For example, if you choose daily you can select every day, every work day or a custom number of days.
Example Report
We had a request to build a report showing all the orders placed last week that contained a full price and sale price item, and within each order the breakout of product IDs and names, units sold and price.
Building this table in Workspace is not too difficult using the Table Builder function, but the resulting table isn’t the easiest thing to analyse:
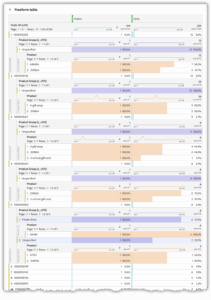
By default only the first five items are broken down and adding the breakdowns for the other 300+ orders will take a long time to do manually.
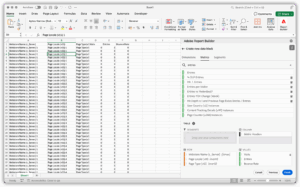
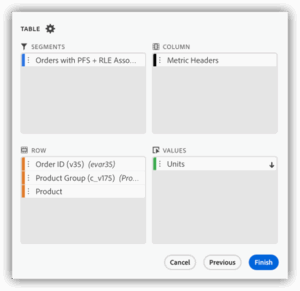
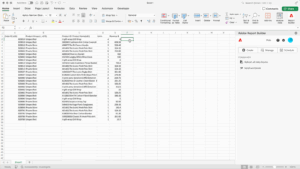
The configuration for the Report Builder looks like this:
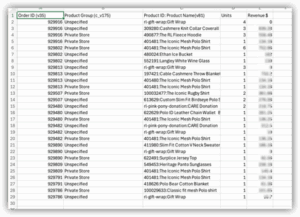
And the output table looks like this:
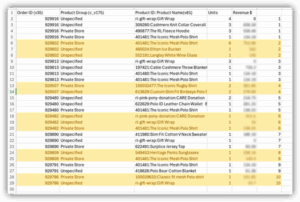
This is much easier to process and analyse and with a bit of conditional formatting the order breaks become even clearer:
Why would I use Report Builder?
Here are some use cases where we have used Report Builder in the past for custom Excel dashboards.
1. Adding branding across the whole dashboard
In Workspace you can add images (from websites) but you are a bit limited on colours and totally restricted on font choices. If you want to brand your dashboards, or want a different layout to the Workspace grid, then you need to extract the data somewhere else.
2. Dynamic input – using the results of one dimension as the input to another query
Workspace doesn’t allow you to take dynamic input from one table to another. Report Builder can take one range of cells as an input filter to another query – perform the first query to pull in the top x dimension values, and then another query using that as the input filter.
Go to the filter dimension options and change the drop down from “Most Popular” to “Specific”, then use the radio button to select “From range of cells”. Select your range of cells and this will then get used as the input filter.
Examples where we’ve used this in campaign product reports, where there are several hundred product IDs included in a campaign that we want to filter on, and creating a segment is too difficult. And of course segments are at hit level, not product level, so any reports in Workspace would potentially bring back extra products outside of the filtered values.
3. Complex sheets with dynamic date ranges that Workspace struggles with
The client for whom I use RB most frequently has financial period dates that we can’t emulate in AA – financial months are a fixed number of weeks rather than based on the calendar month. We have custom date ranges for Workspace, but we aren’t able to do “Last financial month” or “Last financial month last year” in a dynamic way. In RB reports we have a calendar sheet which has dynamic look ups, and then we use that for the start and end dates of queries.
4. Manipulate, aggregate and Clean Up Data
Maybe, for some reason, you don’t want to create a Classification in AA to tidy up some data, or maybe you are reporting on data older than six months old, so need to clean up older values. Excel allows you to add string based formulas to tidy up the data in the sheet, or to aggregate data using standard formulae.
One large dashboard we have that uses Report Builder to populate the data is an Ecommerce Journey OKR dashboard, which shows key objectives for each step of the customer journey, compared to the same time last year.
This dashboard contains a couple of hundred RB queries, covering the whole of the customer journey. It is automatically updated each month and distributed as an Excel report via email. It has a dynamic Country Selector in the top left corner, and displays a range of data in a variety of visualisations.


5. Combining data with other sources
If you need to combine your Adobe data with data from other sources, then Excel can often be one of the most flexible tools. Pulling data from Adobe automatically reduces the requirement for building a dashboard and manually copying and pasting the data in.
Summary
In summary, some of the advantages of the new Report Builder plug in are:
- No IT admin rights required to install – your reporting end users can install it and refresh their own reports
- Much cleaner interface integrated properly into Excel
- Uses the new APIs so removes the traffic / conversion dimension limitations
- Can connect to AA and CJA
- Interface uses familiar layout (pivot table)
If you’re not using this tool already, it’s time to download it and start Report Building!